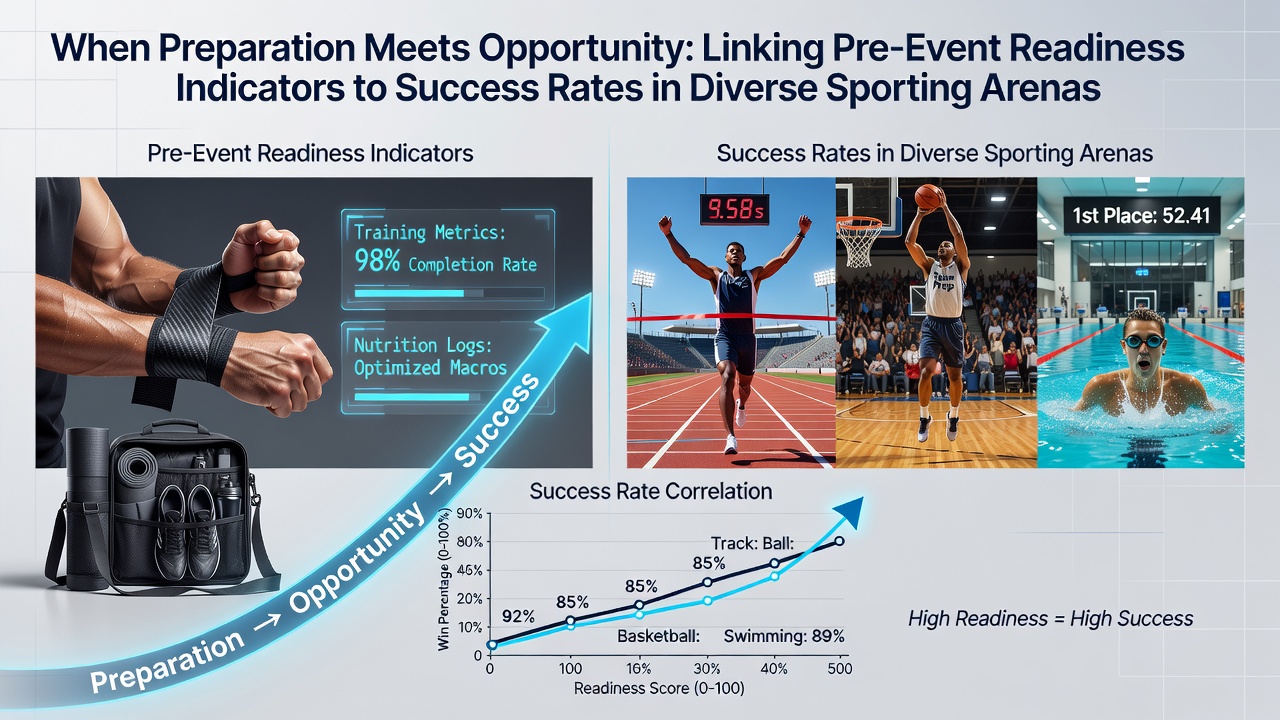
When Preparation Meets Opportunity: Linking Pre-Event Readiness Indicators to Success Rates in Diverse Sporting Arenas
Pre-event readiness indicators encompass measurable factors such as training load, recovery metrics, nutritional status, and psychological assessments that correlate with competitive outcomes across multiple sports. Data collected from professional leagues and international competitions show consistent patterns where athletes and teams scoring higher on these indicators achieve elevated win rates and performance benchmarks. In July 2026, major events including the Wimbledon Championships, the Tour de France, and ongoing domestic football seasons provide fresh datasets for analysis.
Core Readiness Metrics Across Sports
Training volume and intensity tracking form the foundation of readiness evaluations, with wearable devices recording metrics like heart rate variability and sleep duration that predict injury risk and output levels. Studies from the Australian Institute of Sport demonstrate that athletes maintaining optimal sleep scores above 85 percent on standardized scales record 12 to 18 percent improvements in reaction times during matches. Nutrition protocols, including carbohydrate loading and hydration levels measured 48 hours before events, link directly to endurance performance in cycling and football, where teams with documented adherence show fewer late-game declines in speed and accuracy.
Mental preparation indicators, such as pre-competition anxiety inventories and focus drills, appear in basketball and tennis data as predictors of clutch execution. The National Collegiate Athletic Association maintains longitudinal records indicating that players completing structured visualization sessions exhibit higher free-throw percentages and serve consistency under pressure. Horse racing trainers apply similar principles through standardized warm-up routines and veterinary assessments that flag horses with elevated readiness scores for improved finishing positions.
Applications in Team and Individual Sports
Football clubs in the English Championship and Premier League integrate GPS tracking and blood biomarker panels into weekly readiness reports, with aggregated figures revealing that squads scoring in the top quartile for recovery metrics secure approximately 22 percent more points over a season. In tennis, players entering Grand Slam events with documented rest periods exceeding 14 days between tournaments post higher first-serve win percentages according to Association of Tennis Professionals analytics. Basketball teams in the NBA monitor load management through minutes-played thresholds, and data from the 2025-2026 season indicate that rotations respecting these thresholds correlate with improved fourth-quarter scoring margins.
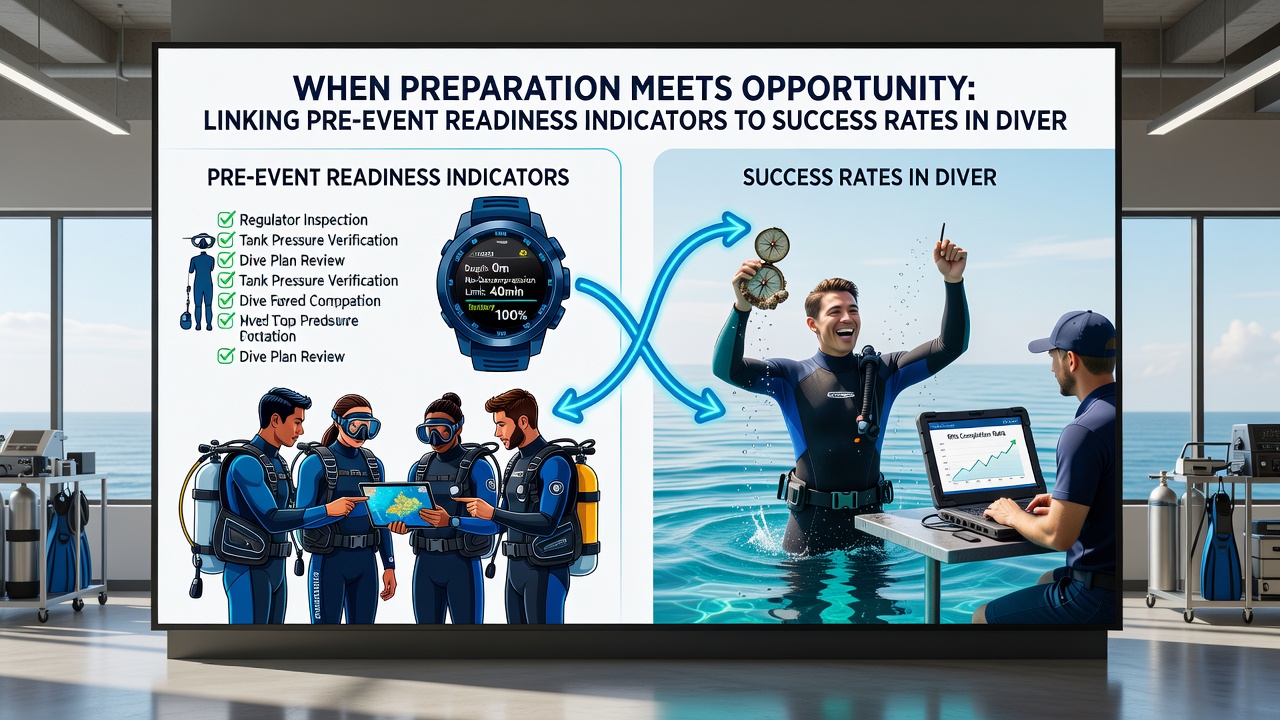
Thoroughbred racing programs in Australia and Europe compile pre-race veterinary and biomechanical data that align with success rates at major meetings. Records from the 2026 Royal Ascot festival illustrate that horses cleared through comprehensive gait analysis and bloodwork protocols achieve win rates 15 percent above baseline expectations. These indicators operate alongside environmental factors such as track conditions, yet the preparation component remains a measurable constant across datasets.
Regional Data Sources and July 2026 Context
European sports federations compile cross-sport readiness databases that feed into performance models, while Canadian university research programs examine similar variables in winter and summer disciplines. Australian Sports Commission reports highlight how integrated monitoring systems support athletes across Olympic and professional pathways. In July 2026, the overlap of tennis majors, football pre-season preparations, and North American basketball off-season conditioning creates overlapping datasets for comparative study.
Observers note that readiness frameworks adapt to sport-specific demands yet share common threads: consistent measurement intervals, threshold-based alerts, and post-event validation against outcomes. Research from the United States Olympic and Paralympic Committee links these practices to medal conversion rates in multi-sport environments, where athletes with verified preparation profiles outperform peers lacking equivalent documentation.
Conclusion
Evidence from multiple governing bodies and longitudinal studies confirms that pre-event readiness indicators connect to measurable success rates when tracked systematically across football, tennis, basketball, and horse racing. The patterns hold in both individual and team contexts, supported by data collected through July 2026 events and prior seasons. Continued refinement of these metrics through academic and industry partnerships sustains their relevance for performance optimization.